2023 Revenue Cycle KPIs to Address Challenges from Denials in Medical Billing and Beyond

3Gen Consulting, Content TeamMay 02, 2023

Healthcare provider finance is moving into an entirely new era. As margins continue to be strained, CFOs are facing new challenges such as the end of the public health emergency, staffing shortages, and millions potentially being thrown off the Medicaid rolls.
This means that while some metrics of the past will serve you well, you will need to prioritize certain KPIs that will help you get through challenges in a world reshaped by COVID.
HFMA has a challenge-based list of KPIs (MAP Keys) to prioritize in 2023 and beyond as you navigate a new world of change [1].
Denials and Self Pay
Continuous coverage during the COVID-19 public health emergency required states to maintain their Medicaid coverage for most people, preventing them from terminating enrollees since March 2020. But as of April 1, 2023, states began reviewing enrollment eligibility to start the process of ending coverage for anyone found ineligible. One of the most significant expectations is that denial prevention (specifically around eligibility denials) will be a key area of necessary response for CFOs. This means that you will need to put revenue-protection initiatives in place. To make sure these are running properly, you will need to focus on a new approach to denials in medical billing, prioritizing KPIs that help you stay on top of medical billing denials and processes that reform your medical billing accounts receivable.
1. Denial Management
Denial management will become increasingly important as you navigate the long-term impact of shifting Medicaid eligibility on your denials results. These codes will be helpful in monitoring this.
1.1. Denial Write-offs as a Percentage of Net Patient Service Revenue (AR-6)
This is a staple of denial KPIs and worth monitoring after software upgrades, and changes to medical billing processes, or contractual relationships.
Equation:

1.2. Remittance Denial Rate (AR-5)
This KPI is also an efficiency and quality indicator.
Equation:

2. Self-Pay Insights
As more patients fall off the Medicaid rolls and have to consider other methods of covering healthcare expenses, you should keep an eye on what’s going on with self-pay. These KPIs illuminate the self-pay gross revenue that isn’t included in your cash, charity, or bad debt metrics.
2.1. Uncompensated Care (FM-4)
Equation:

2.2. Uninsured Discount (FM-3)
Equation:

Other KPIs
The following KPIs will be useful in evaluating and maintaining clean claims that support low denials and efficient revenue cycle processes.
3. Data Governance & Data Quality
As enrollment changes and you see shifts in coverage, stay on top of this number to minimize denials in medical billing.
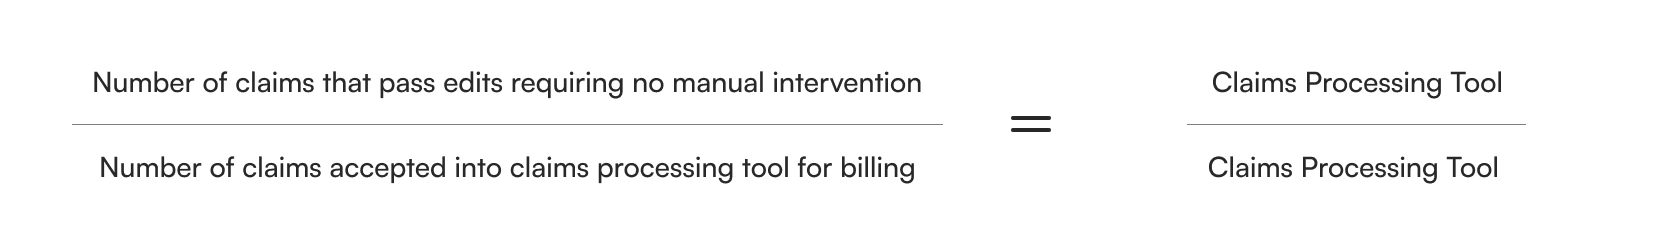
3.1. Clean Claim Rate (CL-1)
Equation:
4. Cash Flows & Collections
Tracking cash flows will be critical as you see changes in patient behavior and are looking for ways to fund solutions to staffing issues. Additionally, if you have growing initiatives such as telehealth, it will be worth tracking these KPIs for those areas specifically. A staple indicator of revenue cycle health, these KPIs will keep you on top of red flags in cash flows and collections activities.
4.1. Bad Debt (AR-7)
This KPI is useful for judging the effectiveness of financial counseling and collection efforts.
Equation:

4.2. Aged A/R as a Percentage of Billed A/R by Payer Group (AR-2)
This KPI provides valuable insight and indicates revenue cycle effectiveness in terms of liquidating A/R by payer group.
Equation:

5. Revenue Cycle Performance
5.1. Net Days in Accounts Receivable (FM-1)
This is a good trending indicator of overall A/R performance that points back to revenue cycle efficiency.
Equation:

5.2. Aged A/R as a Percentage of Total Billed A/R (AR-1)
This trending indicator reflects receivable aging and collectability and points to revenue cycle effectiveness at liquidating A/R.
Equation:

5.3. Aged A/R as a Percentage of Total A/R (AR-3)
Another trending indicator of receivable aging and collectability.
Equation:

6. Identifying Opportunities
While you might have intense focus on staying afloat, don’t forget to keep an eye out for emerging opportunities as the “new normal” emerges.
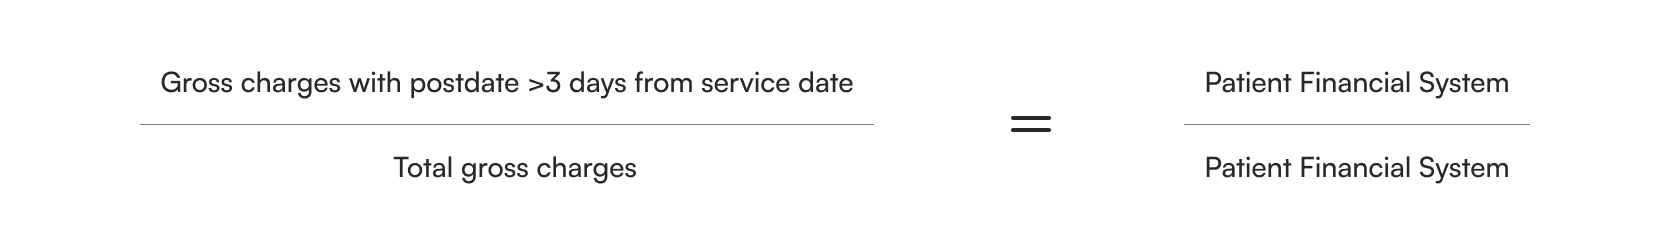
6.1. Late Charges as a Percentage of Total Charges (CL-2)
This KPI reveals opportunities to reduce unnecessary costs, accelerate cash flows, and improve revenue capture.
Equation:
7. Clinical Reporting
Clinical reporting stats will be critical to keep on top of, especially if you’re dealing with high turnover of clinicians, staff burnout, or shortages that are so common among nurses today.
7.1 Case Mix Index (FM-5)
Equation:

8. Overall Financial Health
8.1. Cash Collection as a Percentage of NPR (FM-2)
This KPI is a trending indicator of your ability to turn net patient services into cash and points to the fiscal integrity of your organization.
Equation:

If you’d like guidance in prioritizing your KPIs in light of the end of the public health emergency and how we can support your efforts to minimize denials in medical billing, start here.
[1] HFMA, "HFMA Map Keys," 2023. Available: https://www.hfma.org/data-and-insights/map-initiative/map-keys/.
Are Your Revenue Cycle KPIs Helping You Manage Denials?
Learn which KPIs to prioritize to protect revenue and minimize denials in medical billing.

Connect with our experts to:
- Identify KPIs that drive clean claims and reduce denials
- Optimize accounts receivable and revenue cycle performance
- Monitor cash flow trends to strengthen financial health
Explore our strategic insights & resources


View All ResourcesView All Resources
FAQs
The FAQ section simplifies key information about 3Gen Consulting’s services, helping partners navigate our offerings, methodologies, and value.
Talk to an ExpertTalk to an Expert
Focus on denial write-offs, remittance denial rates, and clean claim rates to monitor and prevent revenue losses effectively.
Tracking uncompensated care and uninsured discounts helps identify gaps in collections and ensures financial sustainability as Medicaid disenrollments rise.
This KPI tracks overall A/R efficiency, helping CFOs detect delays in cash collection and maintain operational liquidity in a post-PHE environment.
Monitoring late charges as a percentage of total charges highlights billing inefficiencies, enabling faster claim submission and improved cash flow.
3Gen provides expertise in identifying, tracking, and optimizing critical KPIs to reduce denials, improve collections, and strengthen overall revenue cycle management.
Metrics like Case Mix Index allow providers to align patient complexity with reimbursement, ensuring accurate revenue forecasting and better financial decision-making.